Live Reporting & Analytics
Live Reporting & Business Intelligence
Many manufacturing and industrial businesses still rely on manual reporting, spreadsheets or disconnected systems to understand production performance. As a result, valuable data may never be captured, can remain disconnected across multiple systems, or isn't available until after production has finished.
The value of live reporting extends far beyond collecting data. It helps businesses identify inefficiencies, reduce waste, minimise downtime, improve productivity and make better business decisions based on accurate, real-time information.
We design and build live reporting, dashboard and business intelligence solutions tailored to the way your business works. Whether integrated into a new automation project, connected to existing machines and business systems, or developed as standalone reporting software, our solutions provide real-time dashboards, KPIs and production visibility to help operators, supervisors and managers monitor performance, identify trends and make informed decisions.
Reporting & Analytics Solutions
Every manufacturing operation is different, which is why reporting requirements vary from business to business. Motion Design develops reporting and analytics solutions engineered for your production processes, goals and existing systems. Whether integrated into a new automation project, connected to existing production lines or developed as a standalone reporting system, our software provides real-time monitoring and the information businesses need to measure performance, identify opportunities for production optimisation and identify opportunities for improvement.
Reporting solutions could include:
- Live production dashboards
- KPI reporting
- Throughput reporting
- Downtime and error reporting
- OEE (overall equipment effectiveness) monitoring
- Actuals versus targets
- Bottleneck analysis
- Historical reporting and trends
- Reporting across multiple machines or sites
- Integration with machines and business systems
Insight
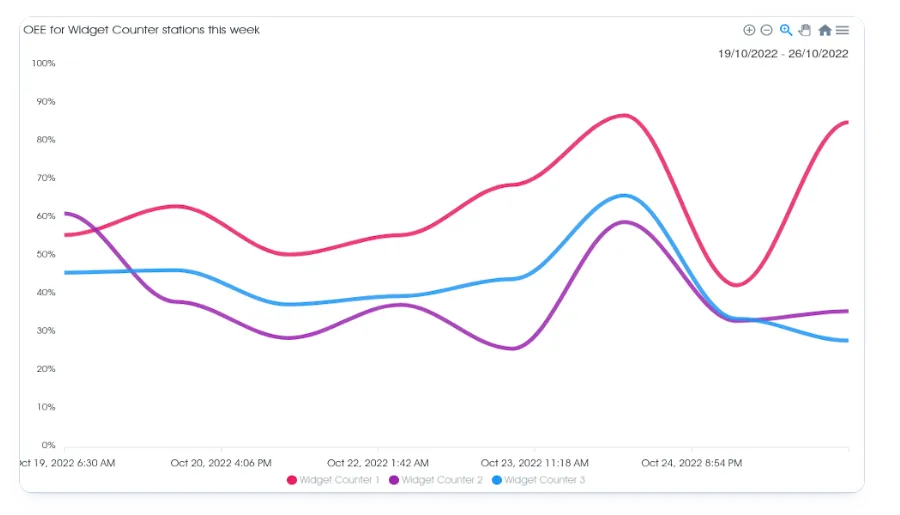
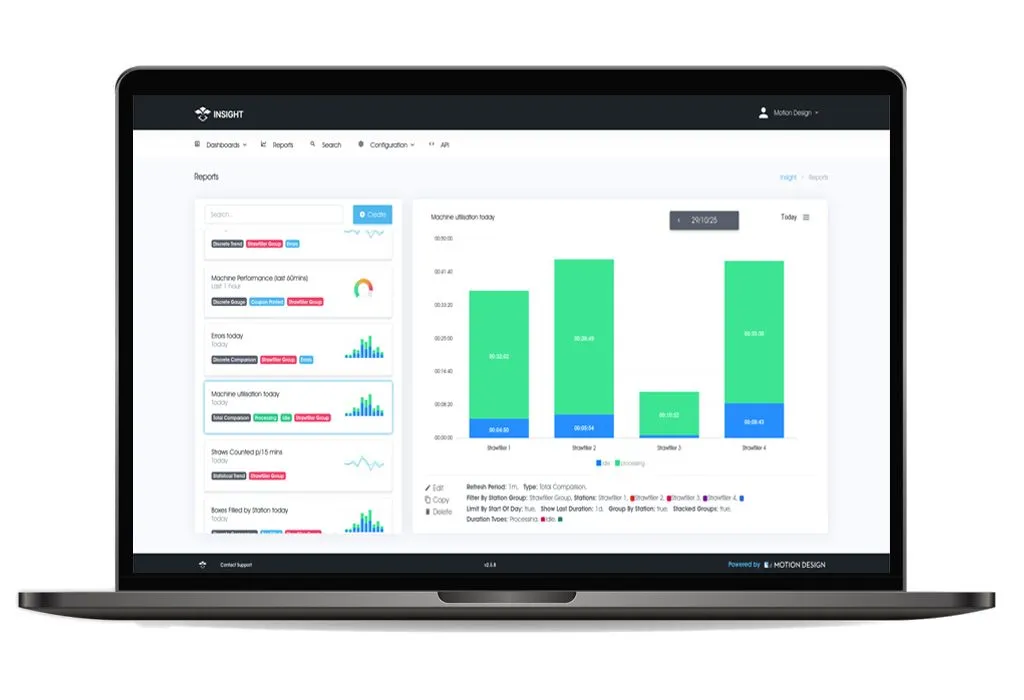
For businesses looking for a proven reporting platform, we have developed Insight, our own live reporting and analytics software. Insight can be configured around your reporting requirements, providing live dashboards, KPI reporting, historical trends and production visibility while integrating with existing machines, ERP, MES, LIMS, CRM and other business systems.
Where Insight isn't the right fit, we can design and develop a completely custom reporting solution around your requirements.
Learn more about Insight
Live Dashboards
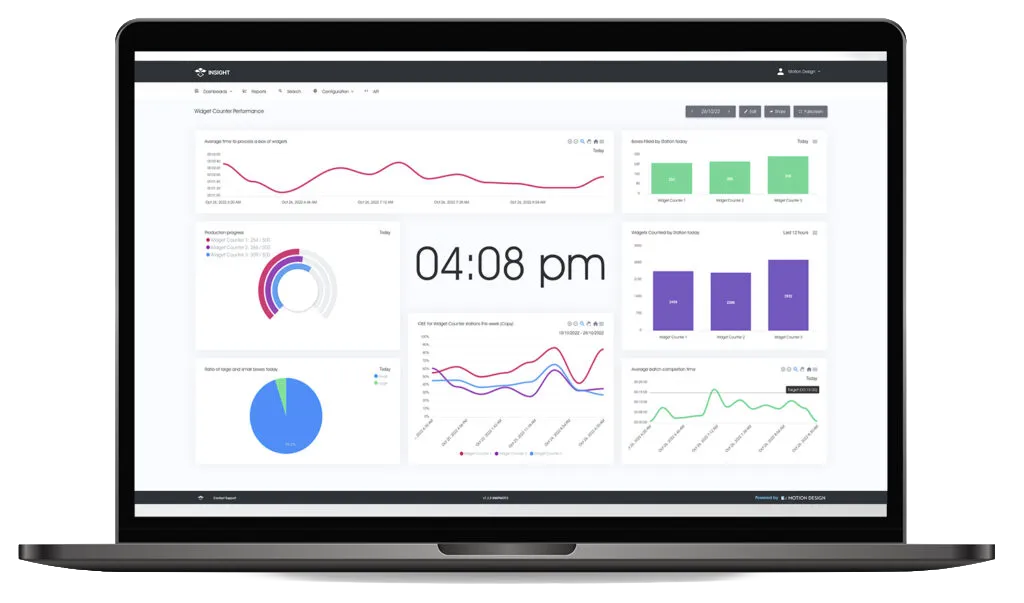
Manufacturing decisions are only as good as the information available at the time. Live dashboards provide a real-time view of production, allowing managers and supervisors to monitor key activities, identify issues as they occur and respond before they impact productivity.
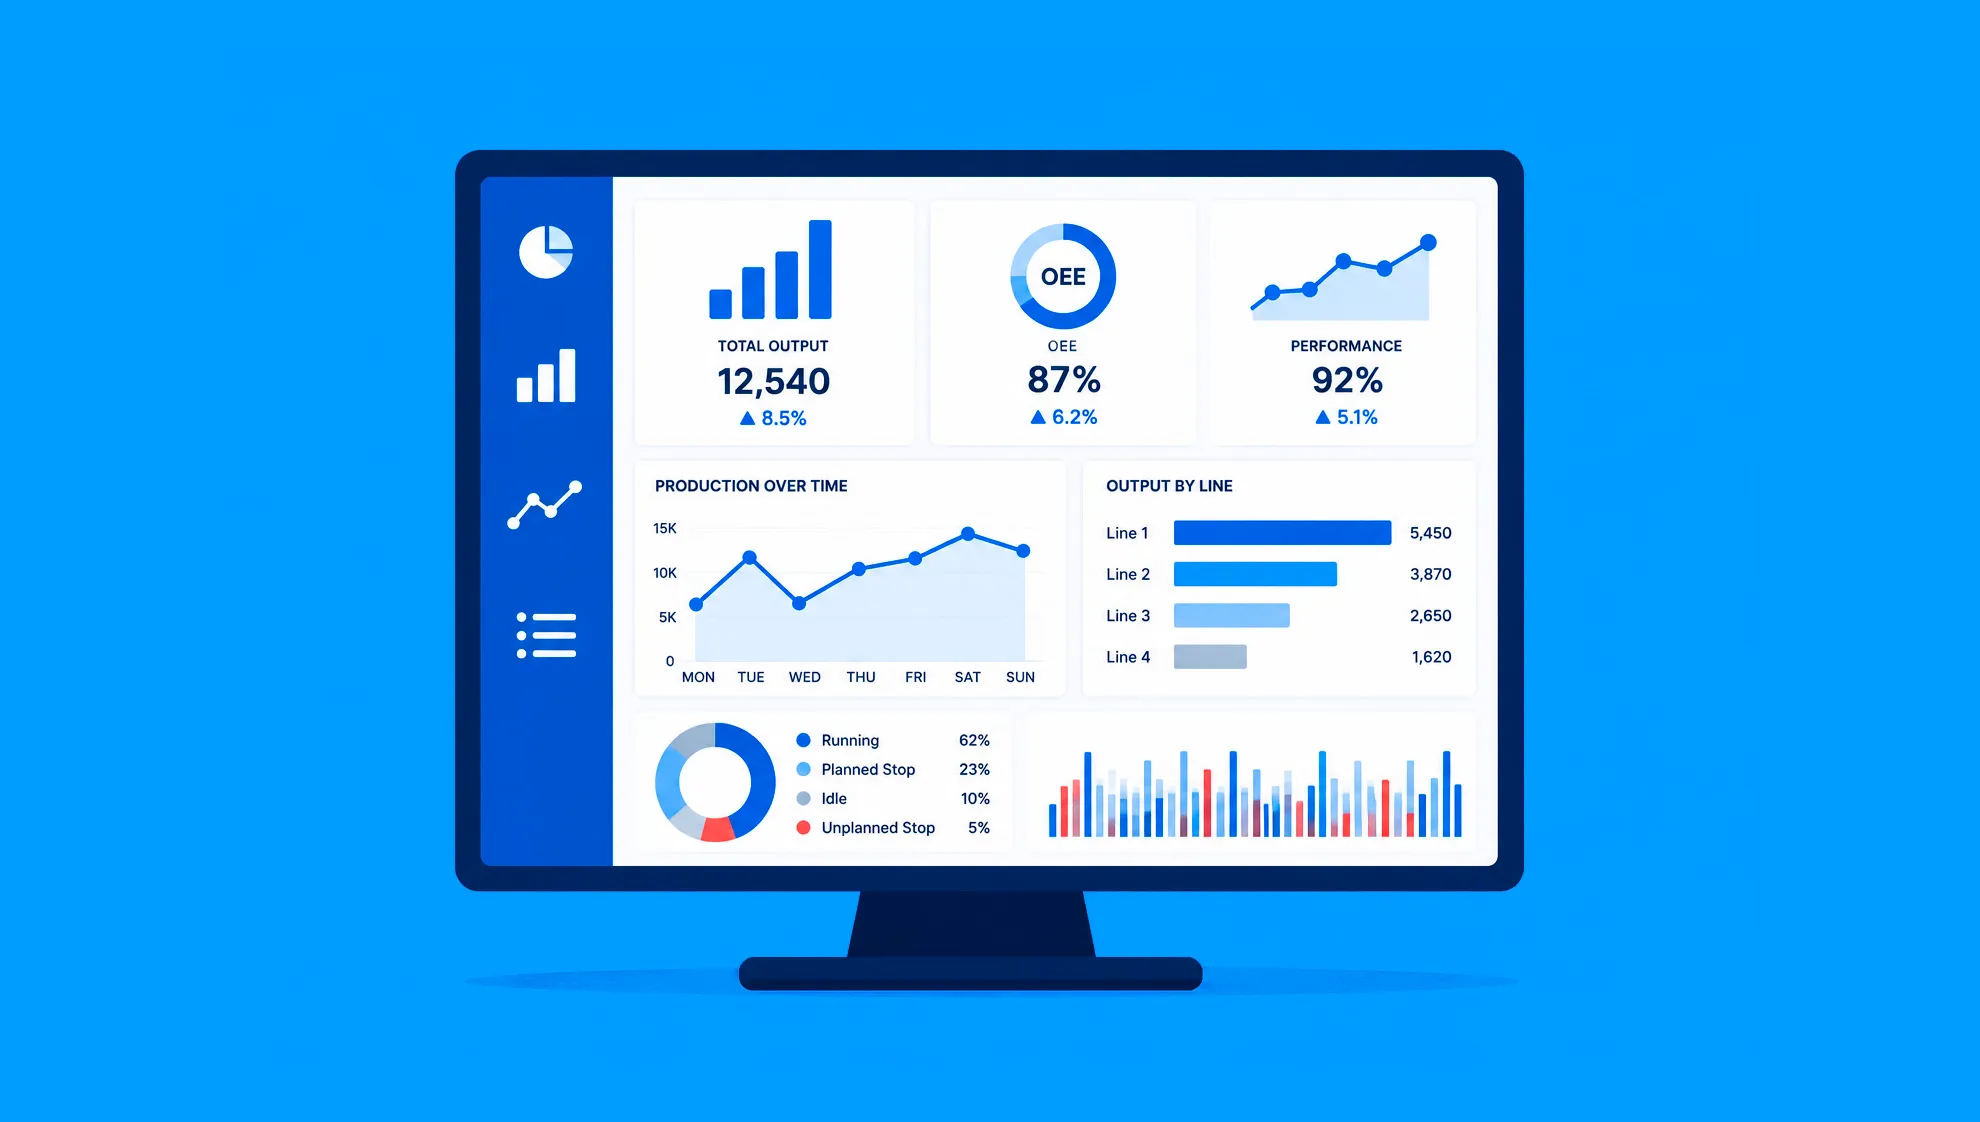
Live dashboards transform production data into meaningful information through dashboards, charts, graphs and reports designed around your business. Depending on your reporting requirements, dashboards can display production output, throughput, downtime, overall equipment effectiveness (OEE), machine status, production targets and other key manufacturing metrics, helping businesses identify bottlenecks, uncover inefficiencies, reduce waste and support continuous improvement.
KPI Reporting
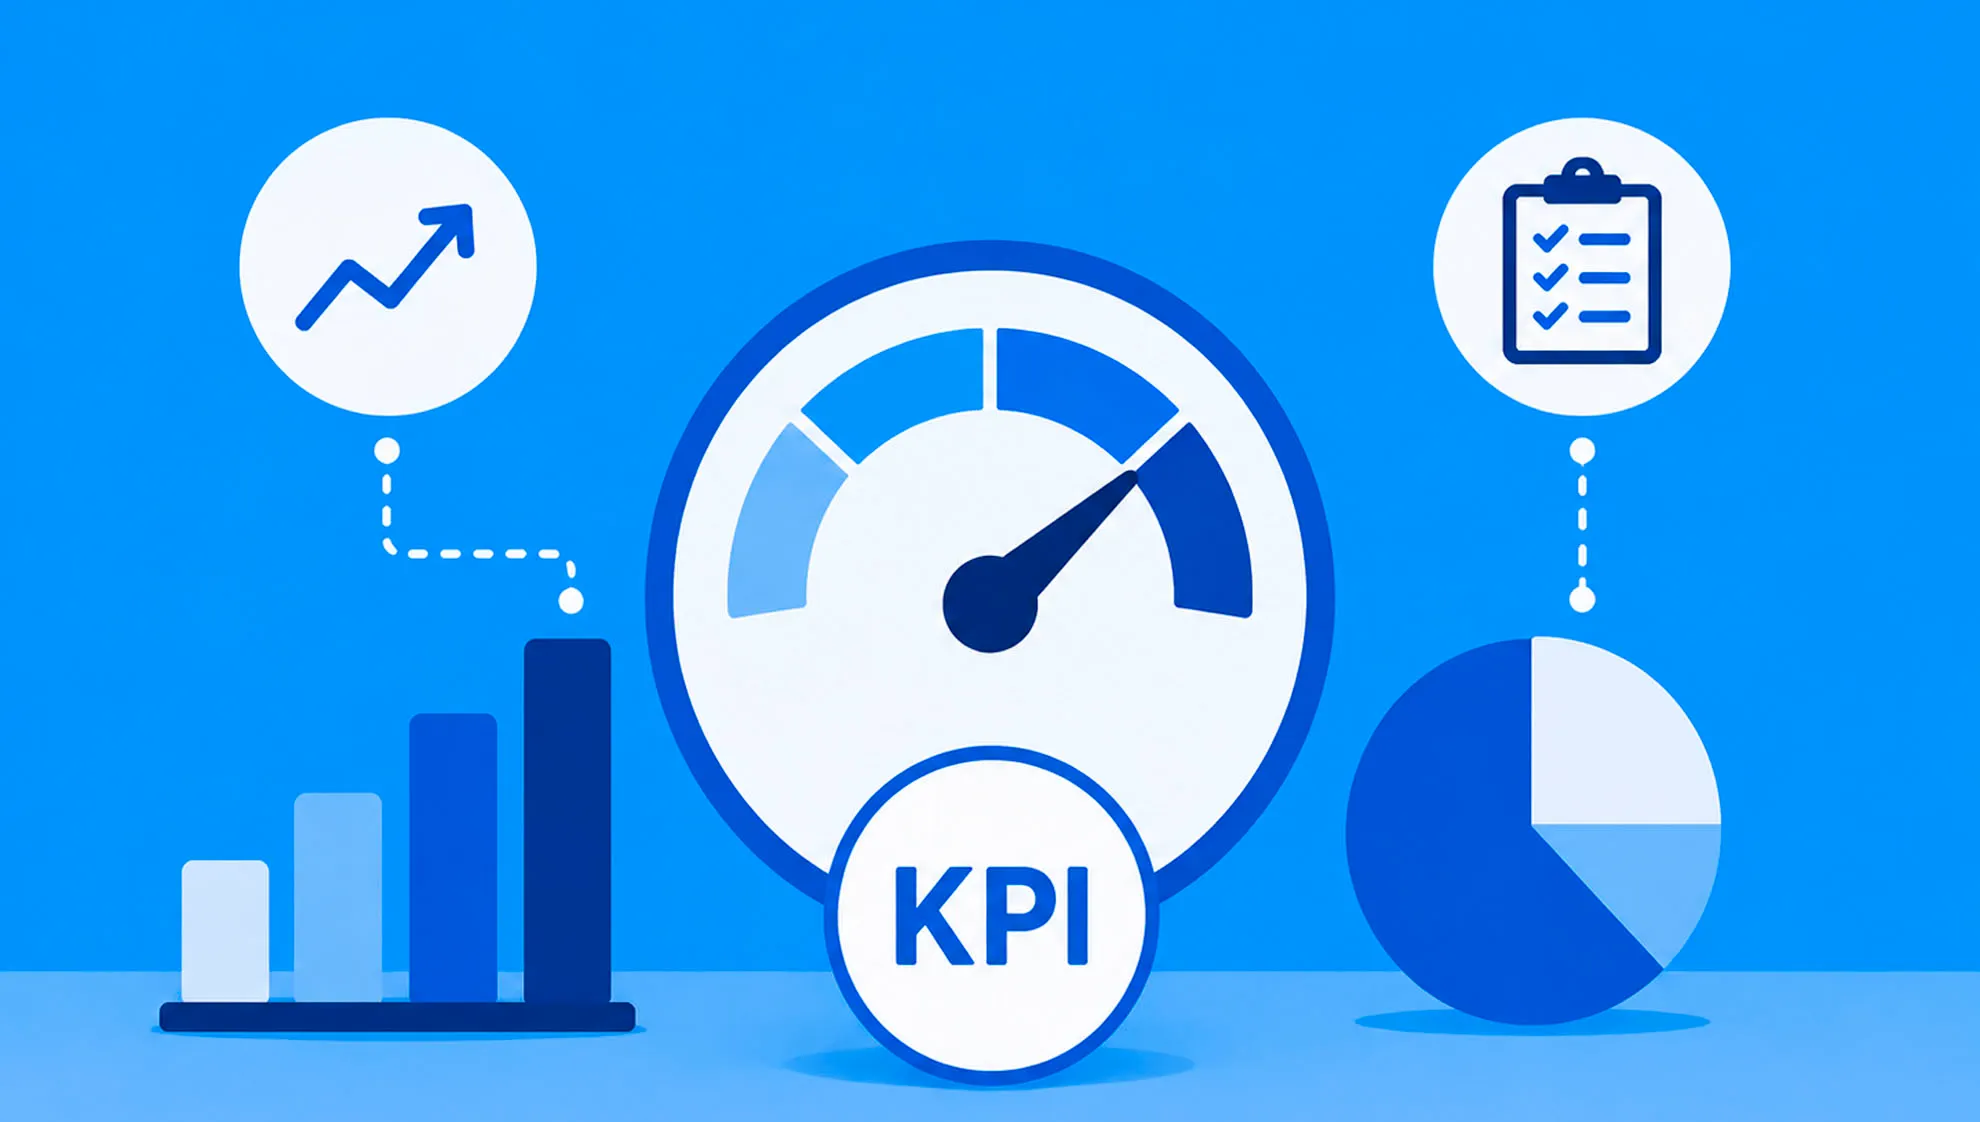
Key Performance Indicators (KPIs) help businesses measure what matters most. By monitoring the right KPIs, manufacturers can measure progress against production targets, identify trends and uncover opportunities to improve productivity, efficiency and profitability. KPI reporting can be tailored to the metrics most important to your business, whether measuring production output, throughput, downtime, quality, labour performance or OEE.
Historical Reporting & Trend Analysis
Historical reporting provides quick access to production information over days, weeks, months or years. Compare shifts, production lines, products, batches or reporting periods to identify trends, investigate issues and measure the impact of process changes over time.
Motion Design tailors historical reporting solutions to your business, with reports, trend analysis and comparative reporting focused on the information you need most. Reports can be filtered, searched and customised to provide meaningful insights across individual machines, production lines, departments or multiple manufacturing sites.
Laboratory Reporting
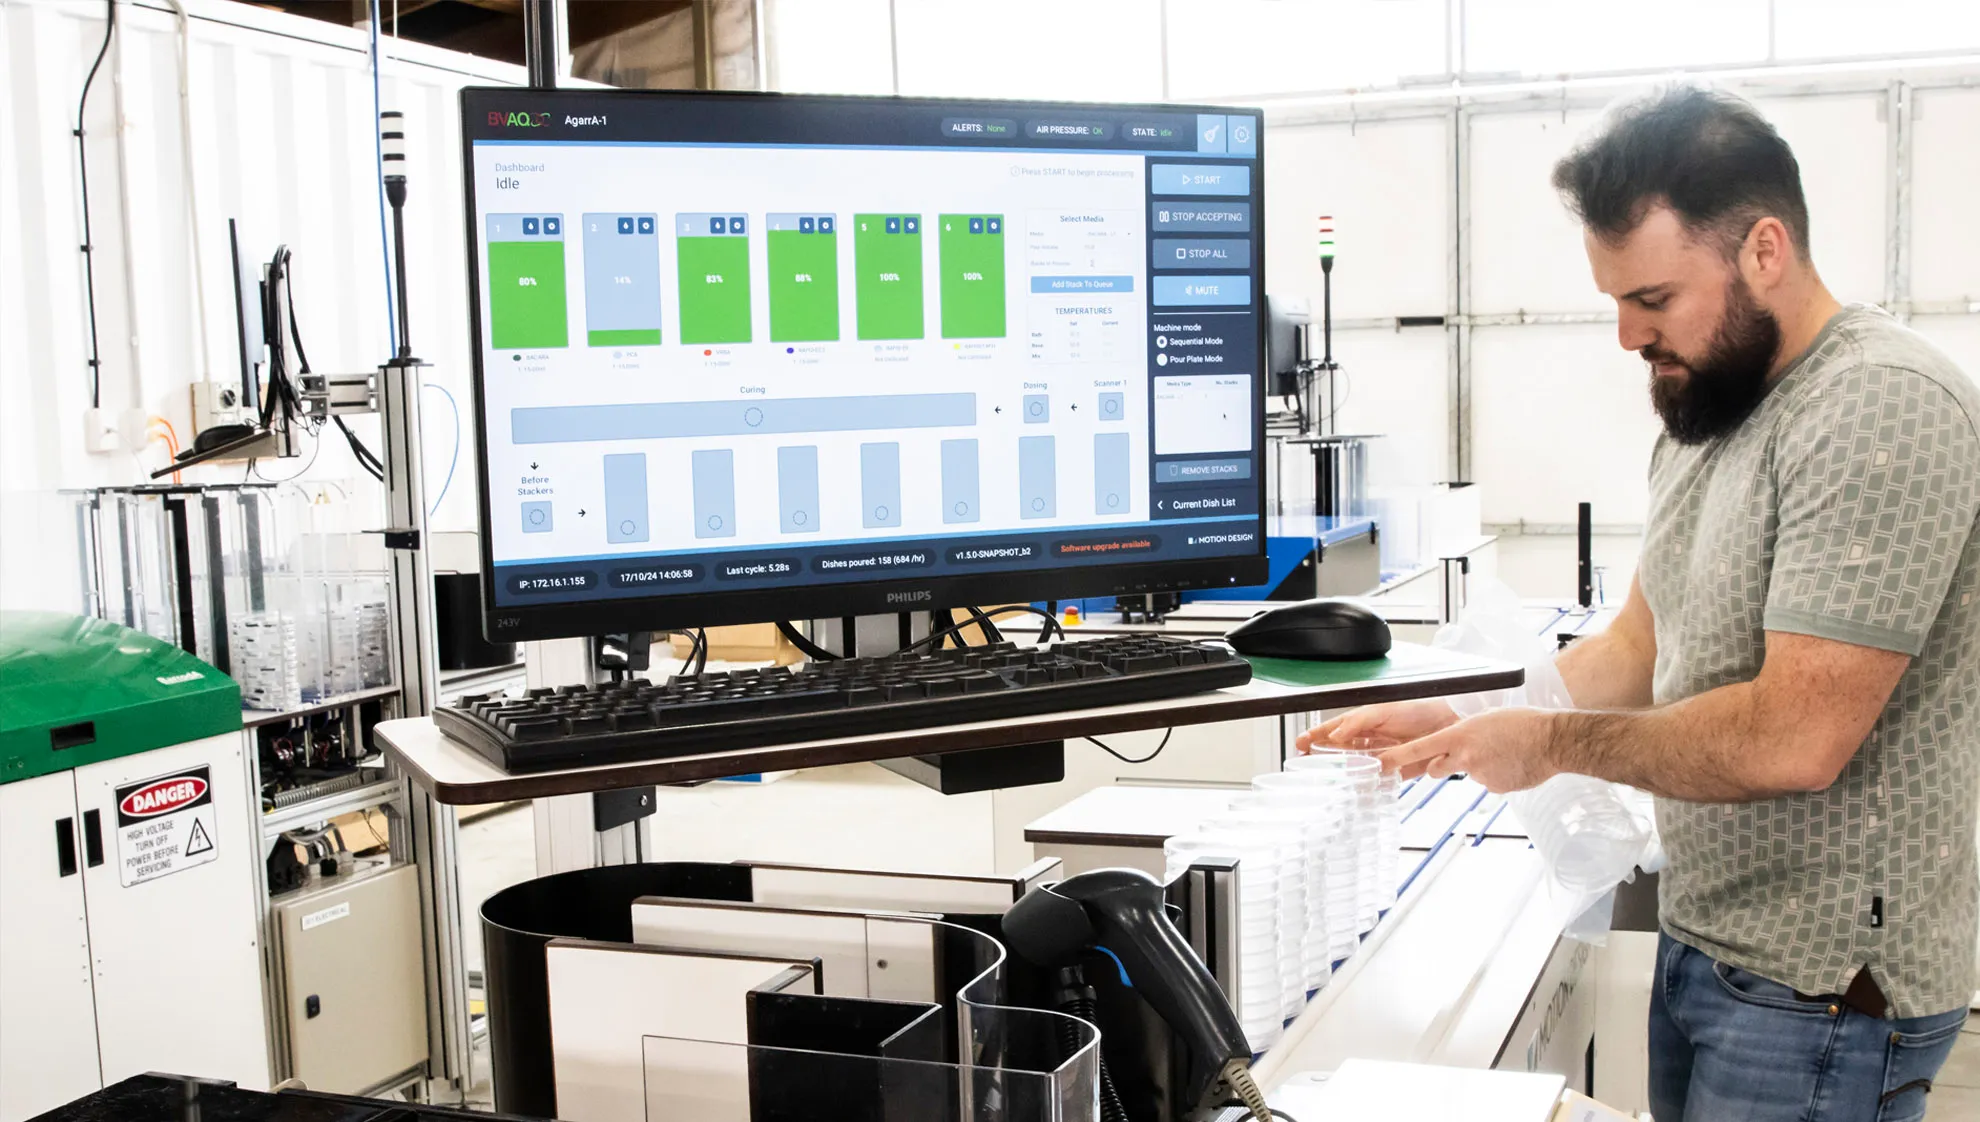
Reporting is equally important in laboratory environments. Motion Design develops laboratory reporting solutions that integrate with LIMS (laboratory Information management systems) and laboratory automation systems, providing reporting tailored to sample workflows, testing processes and laboratory operations.
Learn more about our Laboratory Software solutions .